Revision History
|
Rev. |
Description of Modification |
Date |
|
0. |
First issue for comments |
24/9/2025 |
|
1. |
Response to IECs comments |
2/10/2025 |
|
2. |
Response to IECs comments |
20/10/2025 |
|
3. |
Response to IECs comments |
21/10/2025 |
Table of Content
2.2 Monitoring Parameters, Frequency and Duration
2.4 Monitoring Equipment and Methodology
3.2 Monitoring Parameters, Frequency and Duration
3.6 Maintenance and Calibration
4.2 Water Quality Parameters and Monitoring Frequency
4.4 Monitoring Equipment and Methodology
4.5 Laboratory Measurement and Analysis
5.1 Revision for Inclusion in the EM&A Manual
List of Tables
|
Table 2.1 |
Baseline Air Quality Monitoring Parameters, Frequency and Duration |
|
Table 2.2 |
Air Quality Monitoring Stations for Baseline and Impact Monitoring of Non-Schedule 2 DP under HSK/HT NDA Stage 1 Works |
|
Table 2.3 |
Photo of Baseline Air Quality Monitoring Stations (AM18, AM19 and AM20) |
|
Table 2.4 |
Baseline Air Quality Monitoring Equipment |
|
Table 2.5 |
Summary of Baseline 1-hour TSP Monitoring Results |
|
Table 2.6 |
Determination of Action and Limit Levels for Air Quality Monitoring during Construction Period |
|
Table 2.7 |
Action and Limit Levels of Impact Monitoring of 1-hour TSP |
|
Table 3.1 |
Baseline Construction Noise Monitoring Parameters, Frequency and Duration |
|
Table 3.2 |
Noise Monitoring Stations for Baseline and Impact Monitoring |
|
Table 3.3 |
Summary of Noise Monitoring Results during 07:00 19:00 |
|
Table 3.4 |
Summary of Noise Monitoring Results during 19:00 23:00 |
|
Table 3.5 |
Summary of Noise Monitoring Results during 23:00 07:00 of the following day |
|
Table 3.6 |
Action and Limit Levels for Construction Noise Monitoring |
|
Table 4.1 |
Parameters measured in the Baseline Water Quality Monitoring |
|
Table 4.2 |
Water Quality Monitoring Stations for Non-Schedule 2 DP under HSK/ HT NDA Stage 1 Works |
|
Table 4.3 |
Detection Limits and Precision for Water Quality Determinates |
|
Table 4.4 |
Analytical Methods Applied to Water Quality Samples |
|
Table 4.5 |
Summary of Baseline Water Quality Monitoring Results of U1, SW, HT, TKW and TKW1 (Wet Season) |
|
Table 4.6 |
Summary of Baseline Water Quality Monitoring Results of U1, SW, HT, TKW and TKW1 (Dry Season) |
|
Table 4.7 |
Summary of Baseline Water Quality Monitoring Results at TSR1a, LUTa, LFS, D1 and D2a |
|
Table 4.8 |
Determination of Action and Limit Levels of Water Quality for Impact Monitoring |
|
Table 4.9 |
Action and Limit Levels for Water Quality at SW, HT, TKW1 and TKW (Wet Season) |
|
Table 4.10 |
Action and Limit Levels for Water Quality at SW, HT, TKW1 and TKW (Dry Season) |
|
Table 4.11 |
Action and Limit Levels for Impact Water Quality Monitoring at D2a and D1 |
List of Figures
|
Figure 1.1 |
Project Layout Plan |
|
Figure 2.1 |
Air Quality Monitoring Locations for Schedule 2 Designated Project (DP) under HSK/HT NDA Stage 1 Works |
|
Figure 2.2 |
Air Quality Monitoring Locations for Non-Schedule 2 Designated Project (DP) under HSK/HT NDA Stage 1 Works |
|
Figure 3.1 |
Construction Noise Monitoring Locations for Schedule 2 Designated Project (DP) under HSK/HT NDA Stage 1 Works |
|
Figure 3.2 |
Construction Noise Monitoring Locations for Non-Schedule 2 Designated Project (DP) under HSK/HT NDA Stage 1 Works |
|
Figure 4.1 |
Locations of Water Quality Monitoring Stations for Schedule 2 Designated Project (DP) under HSK/HT NDA Stage 1 Works |
|
Figure 4.2 |
Locations of Water Quality Monitoring Stations for Non-Schedule 2 Designated Project (DP) under HSK/HT NDA Stage 1 Works |
List of Appendices
|
Baseline Air Quality Monitoring Results and Graphical Presentation |
|
|
Extract of Meteorological Observations for Hong Kong Lau Fau Shan |
EXECUTIVE SUMMARY
Baseline monitoring for air quality, noise and water quality for non-Schedule 2 Designated Project (DP) under Hung Shui Kiu/Ha Tsuen New Development Area (HSK/HT NDA) Stage 1 Works were conducted.
A total of 14 air quality monitoring stations was identified for the EM&A programme of non-Schedule 2 DP. Baseline air quality monitoring at AM18, AM19 and AM20 was conducted from 6 August 2025 to 19 August 2025. Baseline air quality monitoring of the other 11 stations (including AM7, AM8a, AM9, AM11, AM12, AM13 AM15, AM21, AM23, AM24 and AM25a) had been carried out before and the monitoring results had been verified. The Action and Limit Levels derived from the Updated EM&A Manual are presented in Table A1.
Table A1 Action and Limit Levels of Impact Monitoring of 1-hour Total Suspended Particulates
|
Monitoring Station(s) |
Action Level (µg/m3) |
Limit Level (µg/m3) |
|
Site 2-18, Site 2-19, Fung Kong Tsuen Road, Ha Tsuen Road/ Lau Fau Shan Road |
||
|
AM18 |
285 |
500 |
|
AM19 |
282 |
|
|
AM20 |
268 |
|
|
AM21 |
275 |
|
|
Road L51 |
||
|
AM23 |
290 |
500 |
|
AM24 |
290 |
|
|
AM25a |
300 |
|
|
Sha Chau Lei Tsuen |
||
|
AM7 |
282 |
500 |
|
AM8a |
267 |
|
|
AM9 |
276 |
|
|
AM11 |
276 |
|
|
AM12 |
273 |
|
|
AM13 |
264 |
|
|
AM15 |
271 |
|
A total of 5 noise monitoring stations was identified for the EM&A programme of non-Schedule 2 DP. Baseline noise monitoring at CM6 had been carried out before and the monitoring results had been verified by the IEC of the project of Road Widening Works at Tin Wah Road. Baseline noise monitoring at CM20, CM22, CM26 and CM30 had also been carried out before and the monitoring results had been verified by the IEC of HSK/HT NDA Second Phase Development. The Action and Limit Levels to be adopted are presented in Table A2.
Table A2 Action and Limit Levels for Construction Noise Monitoring
|
Time Period |
Action |
Limit |
|
07:00 - 19:00 on normal weekdays |
When one or more documented complaints are received |
75 dB(A) |
Table A3 Action and Limit Levels for Water Quality at SW, HT, TKW1 and TKW (Wet Season)
|
Parameters |
Action Levels |
Limit Levels |
|
SW |
||
|
DO (mg/L) |
3.7 |
3.5 |
|
Turbidity (NTU) |
21.4 |
22.9 |
|
SS (mg/L) |
9.7 |
9.9 |
|
pH |
Less than 6.6 or greater than 8.4 |
Less than 6.5 or greater than 8.5 |
|
HT |
||
|
DO (mg/L) |
2.4 |
2.2 |
|
Turbidity (NTU) |
32.3 |
32.6 |
|
SS (mg/L) |
34.0 |
38.7 |
|
pH |
Less than 6.6 or greater than 8.4 |
Less than 6.5 or greater than 8.5 |
|
TKW1 |
||
|
DO (mg/L) |
2.8 |
2.8 |
|
Turbidity (NTU) |
27.9 |
29.2 |
|
SS (mg/L) |
16.0 |
18.4 |
|
pH |
Less than 6.6 or greater than 8.4 |
Less than 6.5 or greater than 8.5 |
|
TKW |
||
|
DO (mg/L) |
2.5 |
2.4 |
|
Turbidity (NTU) |
24.2 |
24.6 |
|
SS (mg/L) |
19.8 |
21.6 |
|
pH |
Less than 6.6 or greater than 8.4 |
Less than 6.5 or greater than 8.5 |
Table A4 Action and Limit Levels for Water Quality at SW, HT, TKW1 and TKW (Dry Season)
|
Parameters |
Action Levels |
Limit Levels |
|
SW |
||
|
DO (mg/L) |
2.3 |
2.1 |
|
Turbidity (NTU) |
22.0 |
22.3 |
|
SS (mg/L) |
8.8 |
10.5 |
|
pH |
Less than 6.6 or greater than 8.4 |
Less than 6.5 or greater than 8.5 |
|
HT |
||
|
DO (mg/L) |
2.2 |
2.1 |
|
Turbidity (NTU) |
18.2 |
20.1 |
|
SS (mg/L) |
7.2 |
7.5 |
|
pH |
Less than 6.6 or greater than 8.4 |
Less than 6.5 or greater than 8.5 |
|
TKW1 |
||
|
DO (mg/L) |
2.1 |
2.0 |
|
Turbidity (NTU) |
16.4 |
17.6 |
|
SS (mg/L) |
7.1 |
7.8 |
|
pH |
Less than 6.6 or greater than 8.4 |
Less than 6.5 or greater than 8.5 |
|
TKW |
||
|
DO (mg/L) |
2.2 |
2.2 |
|
Turbidity (NTU) |
26.0 |
26.7 |
|
SS (mg/L) |
7.0 |
7.1 |
|
pH |
Less than 6.6 or greater than 8.4 |
Less than 6.5 or greater than 8.5 |
Table A5 Action and Limit Levels for Impact Water Quality Monitoring at D2a and D1
|
Parameters |
Action Levels |
Limit Levels |
|
D2a |
||
|
DO (mg/L) |
5.4 |
4 |
|
Turbidity (NTU) |
11.6 |
11.7 |
|
SS (mg/L) |
14.0 |
15.6 |
|
pH |
Less than 6.6 or greater than 8.4 |
Less than 6.5 or greater than 8.5 |
|
D1 |
||
|
DO (mg/L) |
4.2 |
4 |
|
Turbidity (NTU) |
23.4 |
24.5 |
|
SS (mg/L) |
32.8 |
36.8 |
|
pH |
Less than 6.6 or greater than 8.4 |
Less than 6.5 or greater than 8.5 |
1 INTRODUCTION 1.1 Project Background 1.1.1 The HSK/HT NDA occupies an area of approximately 714 ha and is located in the north-western part of the New Territories, midway between Tuen Mun and Tin Shui Wai New Towns. It is bounded by Tin Ying Road/ Ping Ha Road/ Kiu Hung Road to the east, Castle Peak Road to the south, Kong Sham Western Highway (KSWH) to the west, and Tin Ha Road, Lau Fau Shan Road and hillslopes along Deep Bay Road to the north. In the wider context, the proposed Project is strategically located in close proximity to Shenzhen, particularly Shenzhen Bay Control Point, Qianhai, and Shekou and efficiently linked with the Greater Pearl River Delta (PRD) region. The KSWH and the possible highway connecting the Project area with the Tuen Mun - Chek Lap Kok Link, the Hong Kong International Airport, Kwai Tsing Container Terminals, and the Hong Kong-Zhuhai-Macao Bridge and its Boundary Crossing facilities. New strategic highway infrastructure connecting the Project area with the urban area will also be planned to address the long-term development needs of North West New Territories (NWNT). The proposed West Rail Hung Shui Kiu Station (HSK Station), with its alignment traversing the Project allows convenient and efficient access to and from the Project area. 1.1.2 The works under HSK/HT NDA Stage 1 Works comprises: Schedule 2 Designated Project The construction of interim section of new distributor road (Road D1) connecting Sites 3-6, 3-7 and 3-8 to the existing Ha Tsuen Roundabout of KSWH. Road D1 a designated project (DP) defined under item A1 in Schedule 2 of the Environmental Impact Assessment Ordinance) and it is governed under Environmental Permit No. EP-528/2017. Non-Schedule 2 Designated Project: Infrastructure works at Road L51; Site formation and infrastructure works at Site 2-18 and 2-19; Sewer laying works along Fung Kong Tsuen Road and Ping Ha Road/ Lau Fau Shan Road; and Pipe jacking work near Sha Chau Lei Tsuen. 1.1.3 The layout plan for HSK/HT NDA Stage 1 Works is shown in Figure 1.1. 1.1.4 The HSK/HT NDA Stage 1 Works would be implemented under a fast-track programme, involving various complex tasks for providing infrastructure and forming the five development sites to be conducted in parallel, so as to tie in with operation of the development MSBs or other land-efficient means and population intake of the village resite house in 2025 tentatively. 1.1.5 Acuity Sustainability Consulting Limited (ASCL) is commissioned by Civil Engineering and Development Department (CEDD) to undertake the Environmental Team (ET) services as required and/or implied, both explicitly and implicitly, in the Environmental Permit (EP), Environmental Impact Assessment (EIA) Report (Register No. AEIAR-203/2016) and Environmental Monitoring and Audit (EM&A) Manual for the Project; and to carry out the EM&A programme in fulfillment of the EIA Reports, EM&A requirements under Service Contract No. WD/02/2021. 1.1.6 Pursuant to the Environmental Impact Assessment Ordinance (EIAO), the Director of Environmental Protection Department (DEP) granted the Environmental Permits (Nos.: EP-526/2017, EP-527/2017, EP-528/2017, EP-529/2017, EP-530/2017 and EP-531/2017) to the CEDD for the HSK/HT NDA. The HSK/HT NDA Stage 1 Works comprise the interim section of Road D1 that is governed under Environmental Permit No. EP-528/2017. No other Schedule 2 DPs are identified within the scope of HSK/HT NDA Stage 1 Works. 1.2 Purpose of the Report 1.2.1 The EM&A requirements for baseline monitoring under Contract No. YL/2020/03 are set out in the Updated EM&A Manual (April 2022) and Contract Specification. Environmental aspects of air quality, construction noise and water quality were identified as the key issues requiring implementation of monitoring programme during the construction phase of the Project. A Baseline Monitoring Report for Schedule 2 DP (i.e. the interim section of Road D1) had been prepared and submitted in August 2023([1]) under Condition 3.3 of EP-528/2017. 1.2.2 For the concerned areas with ongoing or future construction work for non-Schedule 2 DP under HSK/HT Stage 1 Works, this report presents the baseline air quality, noise and water quality monitoring results at the monitoring stations that are within the buffer distances (500 m for air quality and water quality, and 300 m for noise) from the site boundaries. Action and Limit Levels are also defined for impact monitoring. 1.3 Report Structure 1.3.1 This Baseline Monitoring Report comprises the following sections:
Section 1 introduces the background of the Project and purpose of this Report;
Section 2 presents the baseline monitoring methodologies, requirements, results, influencing factors, as well as determination of the action and limit levels of air quality;
Section 3 presents the action and limit levels of construction noise;
Section 4 presents action and limit levels of water quality; and
Section 5 concludes the findings of baseline monitoring.
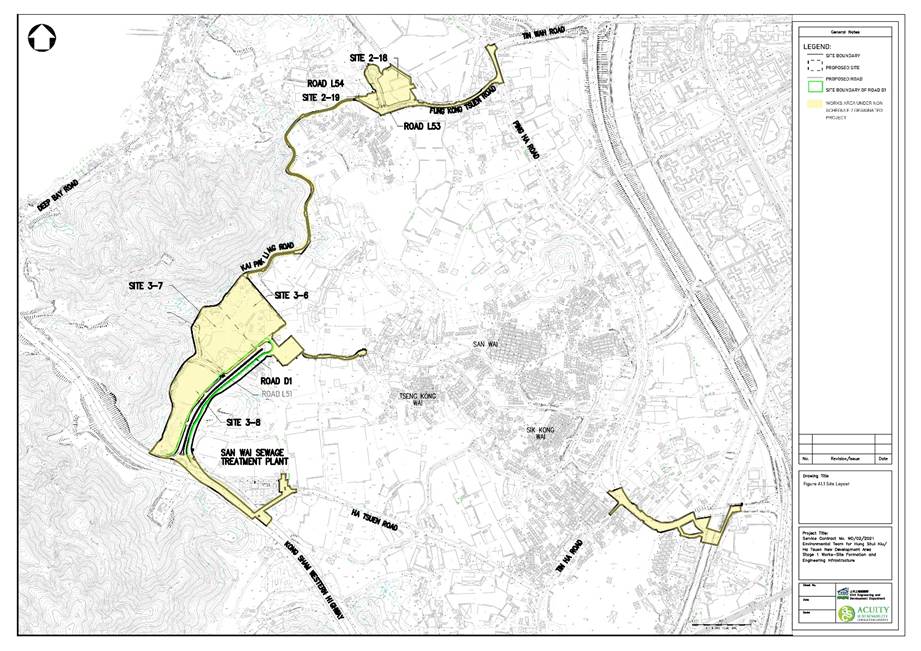 Figure 1.1
Project Layout Plan
Figure 1.1
Project Layout Plan
2 AIR QUALITY 2.1 Monitoring Requirement 2.1.1 Baseline air quality monitoring shall be carried out to determine the ambient 1-hour Total Suspended Particulates (TSP) levels at designated monitoring stations for 14 consecutive days prior to the commissioning of the construction works. 1-hour TSP monitoring should be carried out at least three times per day at each monitoring station when the highest dust impact is expected. 2.2 Monitoring Parameters, Frequency and Duration 2.2.1 Table 2.1 summarizes the monitoring parameters, frequency and duration of baseline air quality monitoring.
Table 2.1 Baseline Air Quality Monitoring Parameters, Frequency and Duration
|
Parameters |
Duration |
Frequency |
|
1-hour TSP |
Daily for at least 14 consecutive days |
3 times per day |
Table 2.2 Air Quality Monitoring Stations for Baseline and Impact Monitoring of Non-Schedule 2 DP under HSK/HT NDA Stage 1 Works
|
Station(s) |
EIA ID |
Monitoring Location |
Approximate Distance between the Stations and the Nearest Site Boundaries |
|
Site 2-18, Site 2-19, Fung Kong Tsuen Road, Ha Tsuen Road/ Lau Fau Shan Road |
|||
|
AM18 |
A1303 |
Sha Kong Wai Tsai |
77 m |
|
AM19 |
A1305 |
Ngau Hom Tsuen |
389 m |
|
AM20 |
A1302 |
Wing Jan School |
352 m |
|
AM21 |
A1002 |
Fung Kong Tsuen |
86 m |
|
Road L51* |
|||
|
AM23 |
P1032 |
Planned Port Back-up, Storage and Workshop (at Site 3-6) |
176 m |
|
AM24 |
P1501 |
Planned Port Back-up, Storage and Workshop (at Site 3-8) |
288 m |
|
AM25a |
- |
San Wai Sewage Treatment Plant near the Planned Port Back-up, Storage and Workshop (at Site 3-14) |
304 m |
|
Sha Chau Lei Tsuen |
|||
|
AM7 |
A414 |
Shek Po Tsuen |
487 m |
|
AM8a |
A813 |
Block J, Tin Shing Court |
221 m |
|
AM9 |
A702 |
San Uk Tsuen |
349 m |
|
AM11 |
A703 |
Sha Chau Lei Tsuen |
28 m |
|
AM12 |
A704 |
Ha Tsuen Shi |
245 m |
|
AM13 |
A708 |
Sik Kong Wai |
351 m |
|
AM15 |
A1101 |
Lo Uk Tsuen |
480 m |
Table 2.3 Photos of Air Quality Monitoring Stations (AM18, AM19 and AM20)
|
ID |
Direct Reading Dust Meter Position |
Monitoring Direction |
|
AM18 |
|
|
|
AM19 |
|
|
|
AM20 |
|
|
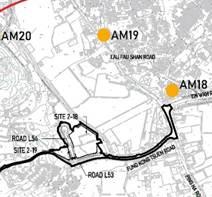
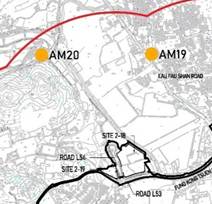
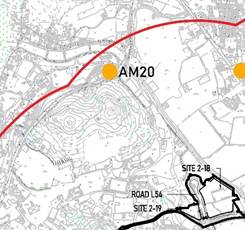
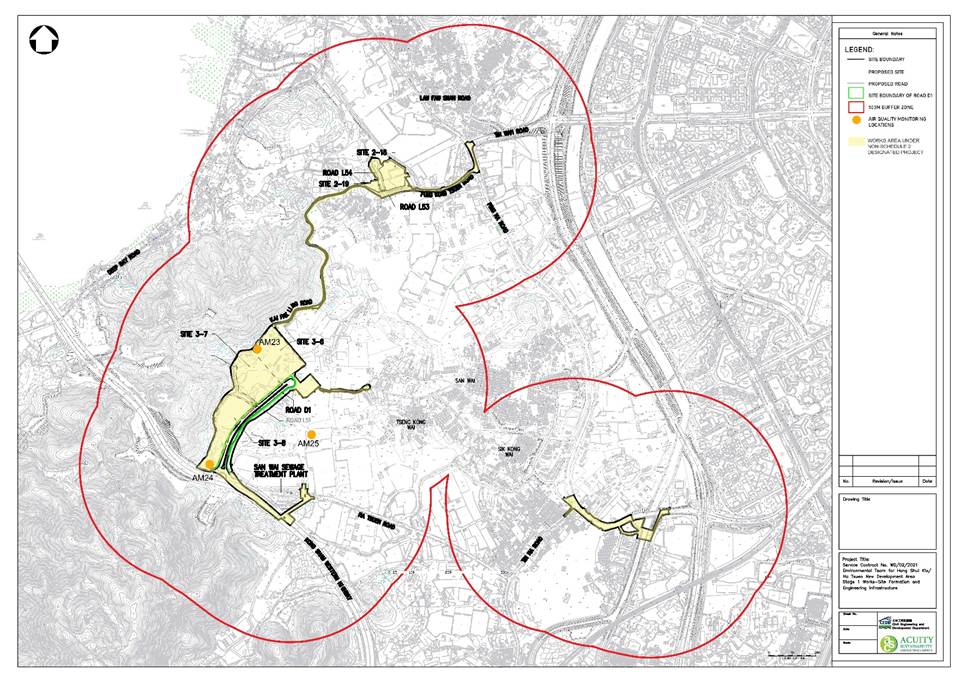
Figure 2.1 Air Quality Monitoring Locations for Schedule 2 Designated
Project (DP) under HSK/HT NDA Stage 1 Works
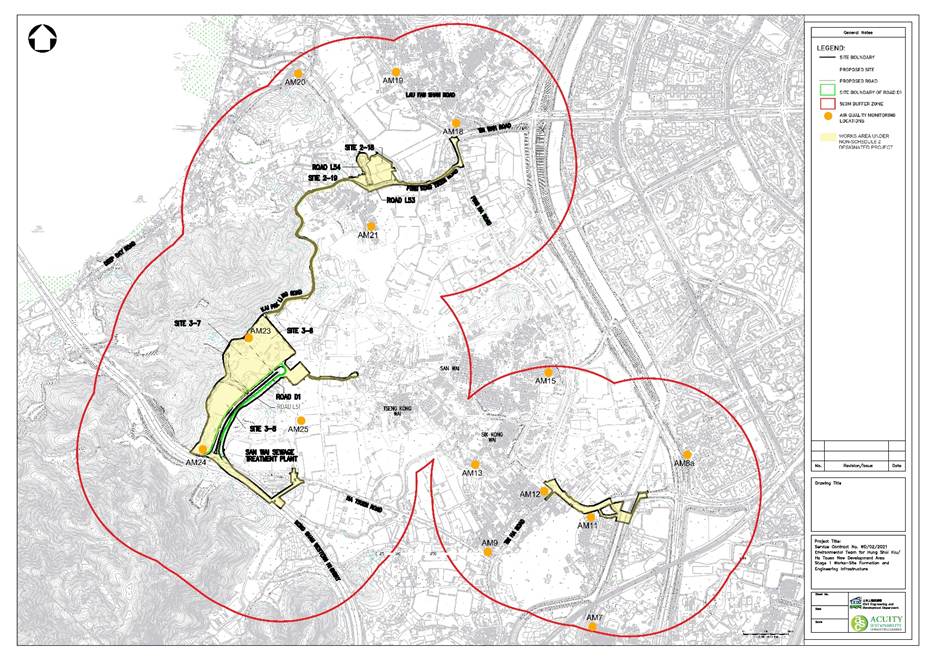
Figure 2.2 Air Quality Monitoring Locations for Non-Schedule 2 Designated Project (DP) under HSK/HT NDA Stage 1 Works
2.4 Monitoring Equipment and Methodology 2.4.1 Direct reading dust meters were used for measuring 1-hour TSP levels during the baseline air quality monitoring. According to paragraph 4.3.5 of the Updated EM&A Manual([3]), the proposed use of direct reading dust meter was submitted to and agreed by the IEC of HSK/HT NDA Stage 1 Works. 2.4.2 The direct reading dust meters have been calibrated against high volume samplers (HVSs) annually. A 2-day, three 3-hour measurement results per day from direct reading dust meters were taken to compare with the sampling results from the HVSs. The correlation between the direct reading dust meters and the HVSs were then concluded. By accounting for the correlation factor, the direct reading dust meters are considered to achieve comparable results as that of the HVSs. 2.4.3 Sufficient number of monitoring instruments were prepared by the ET for carrying out the baseline monitoring. All equipment and associated instrumentation were clearly labelled. 2.4.4 Equipment used in the baseline air quality monitoring for AM18, AM19 and AM20 is summarized in Table 2.4. Calibration certificates for the air quality monitoring equipment used in the baseline air quality monitoring for AM18, AM19 and AM20 are presented in Appendix A.
Table 2.4 Baseline Air Quality Monitoring Equipment
|
Equipment |
Brand and Model |
Serial No. |
|
Direct Reading Dust Meter |
Sibata LD-5R |
851816 |
|
851820 |
||
|
992821 |
||
|
0Z4545 |
2.5 Results and Observations 2.5.1 The baseline air quality monitoring at AM18, AM19 and AM20 was carried out between 6 and 19 August 2025 (Figure 2.2). The monitoring results are presented in Appendix B. Weather condition of the whole baseline monitoring period was sunny, fine, cloudy and rainy. Extracts of Meteorological Observations for Hong Kong available from the Hong Kong Observatory Lau Fau Shan, which reflect the weather summary of the baseline air quality monitoring period, are presented in Appendix D. 2.5.2 Table 2.5 summarizes the baseline air quality monitoring results of AM18, AM19 and AM20. The IEC of HSK/HT NDA Second Phase Development verified the baseline monitoring results of AM7, AM8a, AM9, AM11, AM12, AM13, AM15, AM21, AM23, AM24 and AM25a are also presented in Table 2.5.
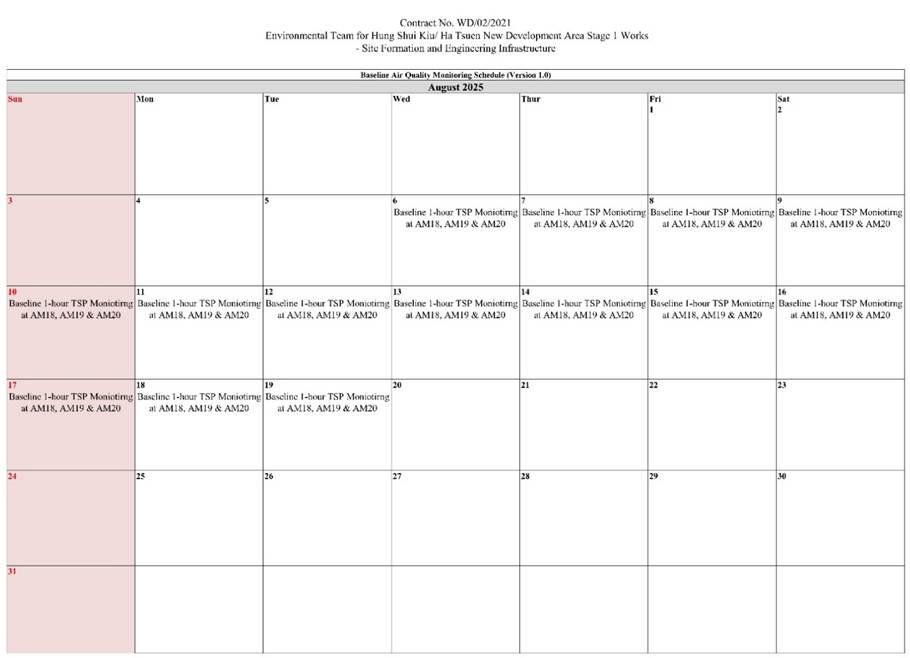
Figure 2.2 Baseline Air Quality Monitoring Schedule (AM18, AM19 and AM20)
Table 2.5 Summary of Baseline 1-hour TSP Monitoring Results
|
Monitoring Stations |
TSP Concentration, μg/m3 |
||
|
Average |
Minimum |
Maximum |
|
|
Site 2-18, Site 2-19, Fung Kong Tsuen Road, Ha Tsuen Road/ Lau Fau Shan Road |
|||
|
AM18 |
54 |
28 |
88 |
|
AM19 |
49 |
23 |
78 |
|
AM20 |
28 |
11 |
45 |
|
AM21* |
38 |
24 |
56 |
|
Road L51 |
|||
|
AM23 |
62 |
51 |
71 |
|
AM24 |
62 |
51 |
70 |
|
AM25a |
77 |
62 |
98 |
|
Sha Chau Lei Tsuen |
|||
|
AM7* |
49 |
34 |
67 |
|
AM8a* |
26 |
13 |
54 |
|
AM9* |
39 |
20 |
61 |
|
AM11* |
39 |
22 |
60 |
|
AM12* |
35 |
18 |
58 |
|
AM13* |
21 |
11 |
42 |
|
AM15* |
32 |
16 |
50 |
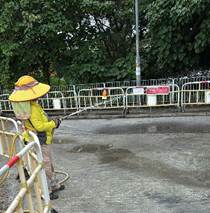
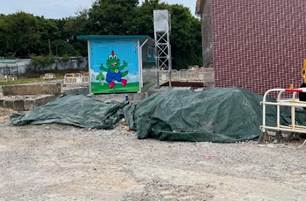
Plate 2.1 Air Quality Mitigation Measures Recorded on site on 6 August 2025
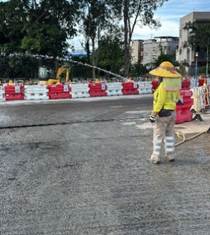
Plate 2.2 Air Quality Mitigation Measures Recorded on site on 7 August 2025
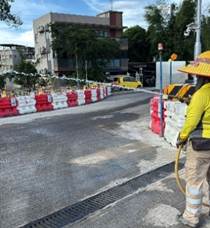
Plate 2.3 Air Quality Mitigation Measures Recorded on site on 8 August 2025
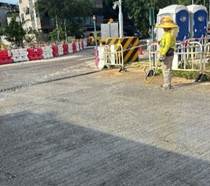
Plate 2.4 Air Quality Mitigation Measures Recorded on site on 9 August 2025
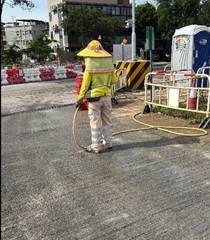
Plate 2.5 Air Quality Mitigation Measures Recorded on site on 11 August 2025
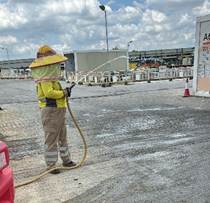
Plate 2.6 Air Quality Mitigation Measures Recorded on site on 12 August 2025
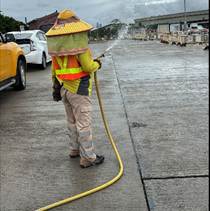
Plate 2.7 Air Quality Mitigation Measures Recorded on site on 13 August 2025
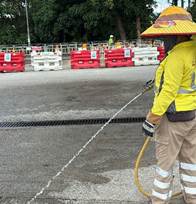
Plate 2.8 Air Quality Mitigation Measures Recorded on site on 14 August 2025
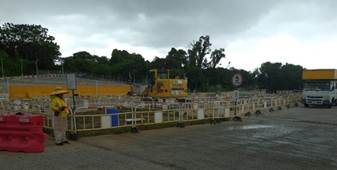
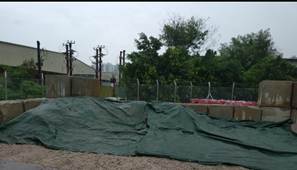
Plate 2.9 Air Quality Mitigation Measures Recorded on site on 15 August 2025
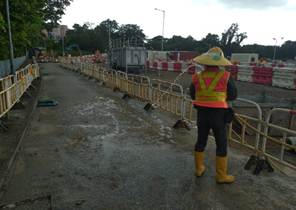
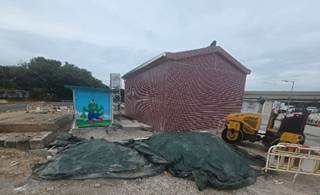
Plate 2.10 Air Quality Mitigation Measures Recorded on site on 16 August 2025
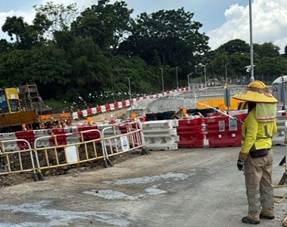
Plate 2.11 Air Quality Mitigation Measures Recorded on site on 18 August 2025
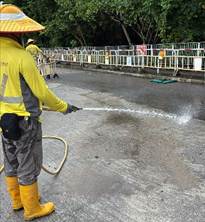
Plate 2.12 Air Quality Mitigation Measures Recorded on site on 19 August 2025
2.6 Action and Limit Levels 2.6.1 The baseline 1-hour TSP monitoring results form the basis for determining the air quality criteria for the impact monitoring. Table 2.6 shows the criteria for establishing the Action and Limit Levels for air quality monitoring.
Table 2.6 Determination of Action and Limit Levels for Air Quality Monitoring during Construction Period
|
Parameters |
Action Level (µg/m3) |
Limit Level (µg/m3) |
|
1-hour TSP Level (µg/m3) |
BL ≤ 384 µg/m3, AL = (BL × 1.3 + LL)/2 BL > 384 µg/m3, AL = LL |
500 |
Table 2.7 Action and Limit Levels of Impact Monitoring of 1-hour TSP
|
Monitoring Station(s) |
Action Level (µg/m3) |
Limit Level (µg/m3) |
|
Site 2-18, Site 2-19, Fung Kong Tsuen Road, Ha Tsuen Road/ Lau Fau Shan Road |
||
|
AM18 |
285 |
500 |
|
AM19 |
282 |
|
|
AM20 |
268 |
|
|
AM21 * |
275 |
|
|
Road L51 |
||
|
AM23 |
290 |
500 |
|
AM24 |
290 |
|
|
AM25a |
300 |
|
|
Sha Chau Lei Tsuen |
||
|
AM7 * |
282 |
500 |
|
AM8a * |
267 |
|
|
AM9 * |
276 |
|
|
AM11 * |
276 |
|
|
AM12 * |
273 |
|
|
AM13 * |
264 |
|
|
AM15 * |
271 |
|
Service Contract
No. WD/02/2021, Environmental Team for Hung Shui Kiu/Ha Tsuen New Development
Area Stage 1 Works Site Formation and Engineering Infrastructure, Baseline
Monitoring Report (Environmental Permit No. EP-528/2017), August 2023.
Table 3.1 Baseline Construction Noise Monitoring Parameters, Frequency and Duration
|
Parameter |
Frequency and Duration |
|
Leq (30mins) (as an average of 6 consecutive Leq (5-min)); L10 (5-min) and L90 (5-min) |
Continuous for 14 consecutive days with each sampling period of 5 minutes throughout the monitoring |
Table 3.2 Noise Monitoring Stations for Baseline and Impact Monitoring
|
ID No. |
EIA ID |
Location |
Nature of Use |
Type of Measurement |
|
Site 2-18, Site 2-19, Fung Kong Tsuen Road, Ha Tsuen Road/ Lau Fau Shan Road |
||||
|
CM6 (a) |
ELFS03 |
No. 325 Sha Kong Wai |
Residential |
Façade |
|
CM26 (b) |
EFKT01 |
No. 61, Fung Kong Tsuen |
Residential |
Free-Field |
|
CM30 (b) |
21801 |
Planned Residential Development in Site 2-18 |
Residential |
Free-Field |
|
Road L51 |
||||
|
- |
- |
- |
- |
- |
|
Sha Chau Lei Tsuen |
||||
|
CM20 (b) |
ESCL03 |
No. 45, Sha Chau Lei Tsuen |
Residential |
Free-Field |
|
CM22 (b) |
ELUT01 |
Block 11, Yan Wu Garden |
Residential |
Free-Field |
Note:
(a) Baseline noise monitoring carried out under the CEDDs Road Widening Works of Tin Wah Road (Quotation No. PU 01/2024) in accordance with EP-528/2017 was referred.
(b) For Free Field measurement, +3 dB(A) should be added to the measured results.
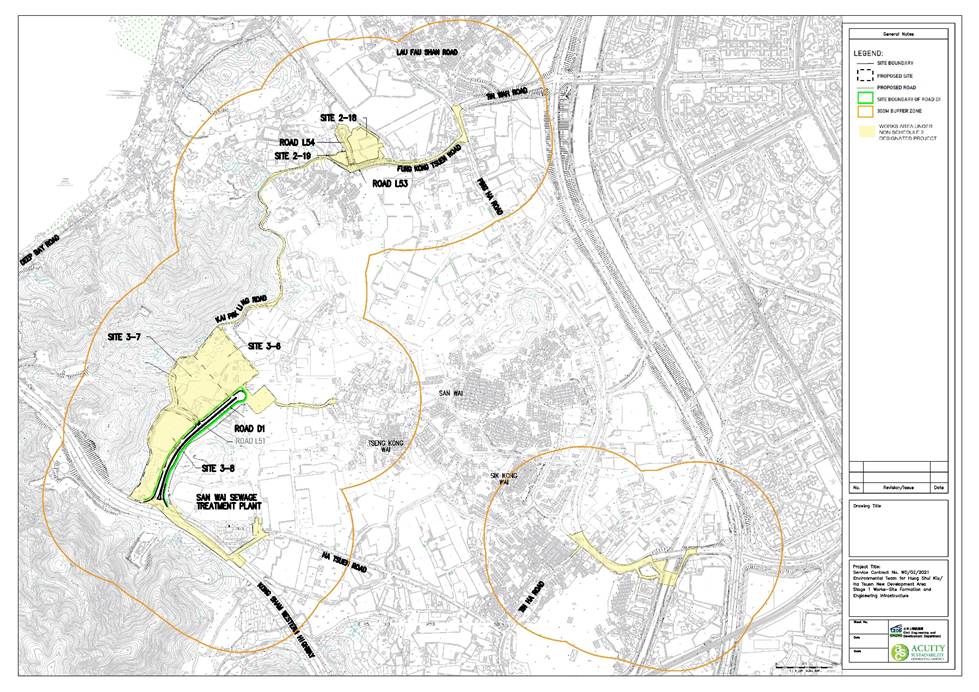
Figure 3.1 Construction Noise Monitoring Locations for Schedule 2 Designated Project (DP) under HSK/HT NDA Stage 1 Works
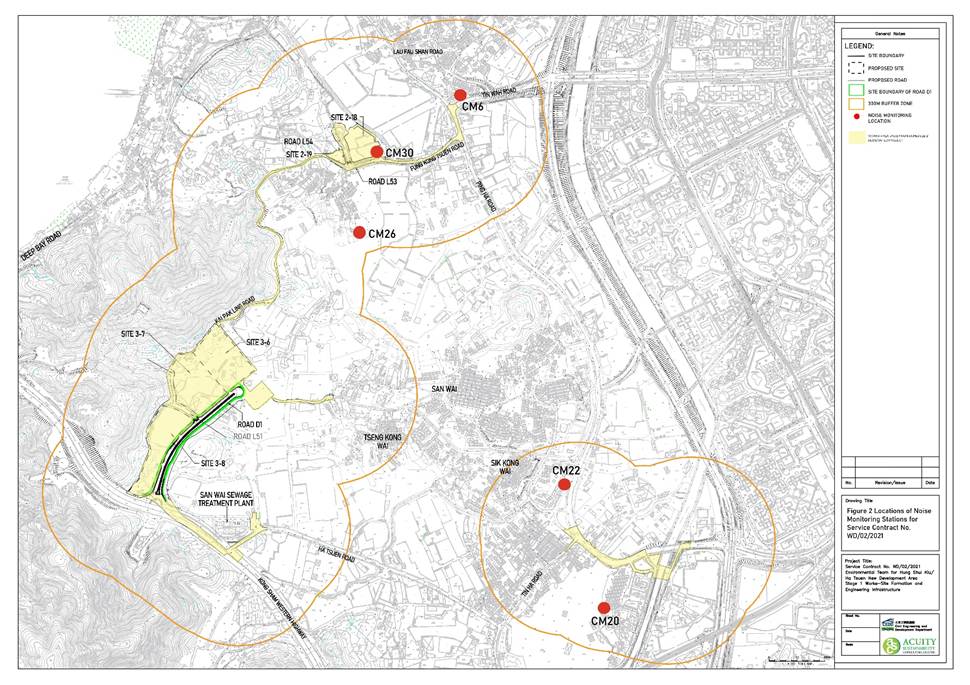
Figure 3.2 Construction Noise Monitoring Locations for Non-Schedule 2 Designated Project (DP) under HSK/HT NDA Stage 1 Works
3.4 Monitoring Equipment 3.4.1 Sound level meters and calibrators shall comply with the International Electrotechnical Commission Publication 651:1979 (Type 1) and 804:1985 (Type 1) specification as referred to in the Technical Memorandum (TM) issued under the Noise Control Ordinance. The sound level meters shall be supplied and used with the manufacturer recommended weather shield as appropriate. 3.4.2 Sound level meters shall be calibrated using a portable calibrator prior to and following each noise measurement. The calibration levels shall be noted with the measurement results and where the difference between the calibration levels is greater than 1.0 dB(A), the measurement shall be repeated. 3.4.3 Noise measurements will not be made in the presence of fog, rain, wind with a steady speed exceeding 5 m/s or wind with gusts exceeding 10 m/s. 3.5 Monitoring Methodology 3.5.1 The details of noise measurement procedures are described as follows:
§ Free-field and façade measurements were made at the monitoring locations.
§ For free field, the sound level meter was set at a height of 1.2 m above ground.
§ For façade measurement, the microphone of the sound level meter was positioned 1 m away from the building external wall of sensitive receiver, and the sound level meter was set up at a height of 1.2 m above ground.
§ Regular visits, for a period of at least once every three to four days, were conducted by the ET to ensure the continuous operation of the sound level meter during the baseline monitoring. The battery condition was checked to ensure proper functioning of the meter.
§ A-weighted Leq, L10 and L90 were measured by weatherproof logging sound level meter over a two-week period, and a sampling period of 5 minutes was used throughout the baseline monitoring.
§ Parameters such as frequency weighting, the time weighting and the measurement time were set as follows:
· Frequency weighting: A
· Time weighting: Fast
· Measurement time: Six consecutive Leq (5-min) readings are measured to
provide Leq (30-min) for the non-restricted hours.
§ Prior to and after each noise measurement, the meter was calibrated using an acoustic calibrator for 94.0 dB at 1000 Hz. If the difference in the calibration level before and after measurement was more than 1.0 dB, the measurement would be considered invalid and repeat of noise measurement would be required after recalibration or repair of the equipment.
§ No construction activities were observed near the monitoring stations during the baseline monitoring. Measurements were recorded to the nearest 0.1 dB.
§ Noise measurement should be paused during periods of high intrusive noise if possible and observation shall be recorded when intrusive noise is not avoided.
§ Noise monitoring should be conducted with the wind speed not exceeding 5 m/s and no gusts exceeding 10 m/s.
3.6 Maintenance and Calibration
3.6.1 Maintenance and calibration procedures are as follows:
· The microphone head of the sound level meter and calibrator were regularly cleaned with a soft cloth; and
· The sound level meter and acoustic calibrator were calibrated annually by a HOKLAS accredited laboratory or the manufacturer.
3.7 Results and Observations 3.7.1 The baseline noise monitoring at CM6 had been conducted under the project of Road Widening Works at Tin Wah Road and the monitoring results were presented in the corresponding Baseline Monitoring Report([5]). The baseline noise monitoring at CM6 had been verified by the IEC of project of Road Widening Works at Tin Wah Road. 3.7.2 The baseline noise monitoring at CM20, CM22, CM26 and CM30 had been conducted under HSK/HT NDA Second Phase Development and the monitoring results were presented in the corresponding Baseline Monitoring Report([6]). The baseline noise monitoring at CM20, CM22, CM26 and CM30 had been verified by the IEC of HSK/HT NDA Second Phase Development. 3.7.3 The verified baseline monitoring results are summarized in Tables 3.3 to 3.5. Table 3.3 Summary of Noise Monitoring Results during 07:00 19:00| Noise Monitoring Station | Average Leq(30-min) | Minimum Leq(30-min) | Maximum Leq(30-min) |
| Site 2-18, Site 2-19, Fung Kong Tsuen Road, Ha Tsuen Road/ Lau Fau Shan Road | |||
| CM6 | 72.7 | 66.5 | 76.1 |
| CM26 * | 47.6 | 38.1 | 64.7 |
| CM30 * | 60.2 | 38.5 | 72.5 |
| Sha Chau Lei Tsuen | |||
| CM20 * | 57.8 | 50.8 | 71.8 |
| CM22 * | 63.9 | 50.6 | 80.8 |
| Noise Monitoring Station | Average Leq(30-min) | Minimum Leq(30-min) | Maximum Leq(30-min) |
| Site 2-18, Site 2-19, Fung Kong Tsuen Road, Ha Tsuen Road/ Lau Fau Shan Road | |||
| CM26 * | 47.5 | 38.5 | 54.8 |
| CM30 * | 57.1 | 38.7 | 71.7 |
| Sha Chau Lei Tsuen | |||
| CM20 * | 55.6 | 48.0 | 66.9 |
| CM22 * | 58.4 | 47.9 | 68.3 |
| Noise Monitoring Station | Average Leq(30-min) | Minimum Leq(30-min) | Maximum Leq(30-min) |
| Site 2-18, Site 2-19, Fung Kong Tsuen Road, Ha Tsuen Road/ Lau Fau Shan Road | |||
| CM26 * | 46.4 | 39.2 | 55.8 |
| CM30 * | 51.2 | 38.5 | 67.6 |
| Sha Chau Lei Tsuen | |||
| CM20 * | 54.6 | 48.3 | 70.1 |
| CM22 * | 56.4 | 44.6 | 78.8 |
Table 3.6 Action and Limit Levels for Construction Noise Monitoring
|
Time Period |
Action |
Limit |
|
07:00 - 19:00 on normal weekdays |
When one or more documented complaints are received |
75 dB(A) |
4 WATER QUALITY 4.1 Monitoring Requirements 4.1.1 In accordance with the recommendations of the EIA Report (EIAO Register No. AEIAR-203/2016) and the Updated EM&A Manual (April 2022), the baseline water quality monitoring was conducted to establish baseline conditions to derive the Action and Limit levels for impact stations. 4.2 Water Quality Parameters and Monitoring Frequency 4.2.1 The parameters that have been selected for measurement in-situ and in the laboratory are those that are either determined in the EIA to be those with the most potential to be affected by the construction works or a standard check on water quality conditions. Parameters to be measured in the baseline water quality monitoring are listed in Table 4.1.
Table 4.1 Parameters measured in the Baseline Water Quality Monitoring
|
Parameters |
Units |
Abbreviations |
Frequency |
|
In-situ measurements |
3 days per week for at least 4 weeks (the interval between 2 sets of monitoring should not be less than 36 hours) |
||
|
Dissolved oxygen |
mg/L |
DO |
|
|
Dissolved oxygen saturation |
% |
DO% |
|
|
Temperature |
℃ |
- |
|
|
pH |
- |
- |
|
|
Turbidity |
NTU |
- |
|
|
Laboratory measurements |
|||
|
Suspended Solids |
mg/L |
SS |
|
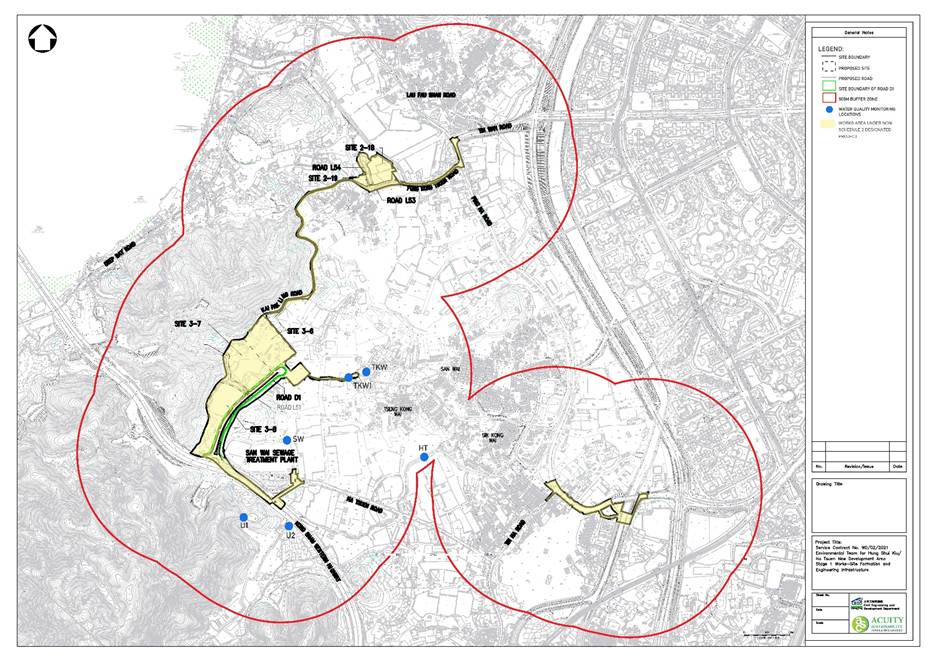
Figure 4.1 Locations of Water Quality Monitoring Stations for Schedule 2 Designated Project (DP) under HSK/HT NDA Stage 1 Works
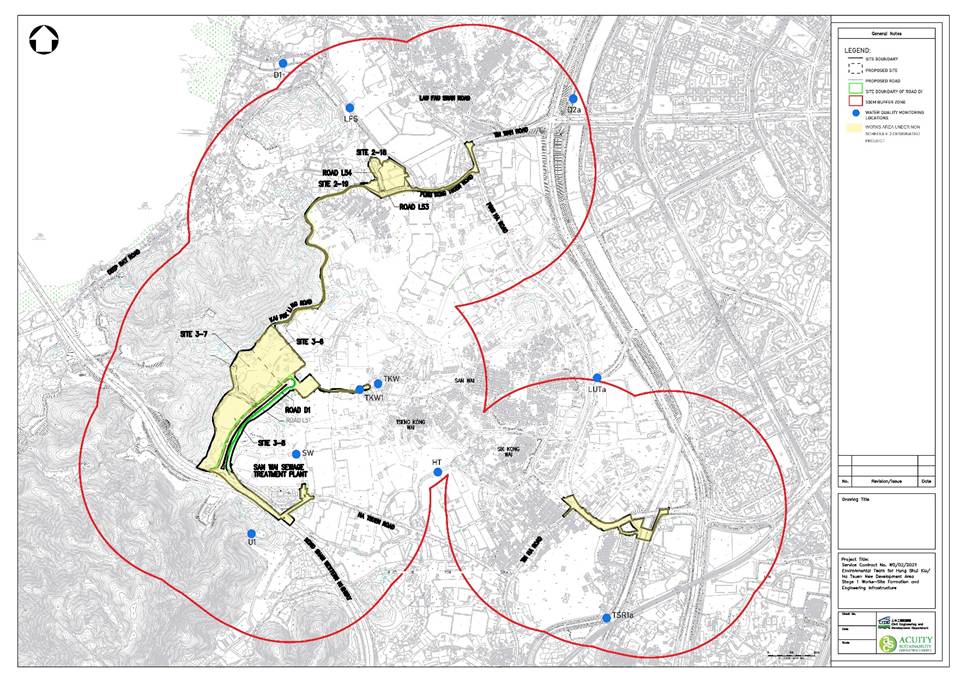
Figure 4.2 Locations of Water Quality Monitoring Stations for Non-Schedule 2 Designated Project (DP) under HSK/HT NDA Stage 1 Works
Table 4.2 Water Quality Monitoring Stations for Non-Schedule 2 DP under HSK/ HT NDA Stage 1 Works
|
Station |
Description |
Easting |
Northing |
|
Site 2-18, Site 2-19, Fung Kong Tsuen Road, Ha Tsuen Road/ Lau Fau Shan Road |
|||
|
LFS |
Gradient station (Downstream of the construction site of Site 2-18 and 2-19) |
816504 |
835862 |
|
D1 |
Impact Station (Downstream of LFS and the construction site of Site 2-18 and 2-19) |
816187 |
836064 |
|
D2a |
Impact Station (Downstream of the construction site at Fung Kong Tsuen Road, Ha Tsuen Road/ Lau Fau Shan Road) |
817483 |
835855 |
|
Road L51 |
|||
|
U1 |
Upstream Station |
815936 |
834150 |
|
SW |
Gradient station (Downstream of U1 and the construction site of Road L51) |
816304 |
834321 |
|
HT |
Gradient station (Downstream of the construction site of Road L51) |
816866 |
834314 |
|
TKW1 |
Gradient station (Downstream of the construction site of Road L51) |
816563 |
834686 |
|
TKW |
Gradient station (Downstream of TKW1 and construction site of Road L51) |
816594 |
834690 |
|
LUTa |
Gradient station (Downstream of the construction site of Road L51) |
817547 |
834717 |
|
D2a |
Impact Station (Downstream of LUTa and the construction site of Road L51) |
817483 |
835855 |
|
Sha Chau Lei Tsuen |
|||
|
TSR1a |
Gradient station (Upstream of the construction site at Sha Chau Lei Tsuen) |
817786 |
834125 |
|
LUTa |
Gradient station (Downstream of the construction site at Sha Chau Lei Tsuen) |
817547 |
834717 |
|
D2a |
Impact Station (Downstream of TSR1a and LUTa, and the construction site of Sha Chau Lei Tsuen) |
817483 |
835855 |
Table 4.3 Detection Limits and Precision for Water Quality Determinates
|
Parameters |
Detection limit |
Accuracy |
Precision |
|
DO |
0 20 mg/L |
± 0.1 mg/L |
25% |
|
Temperature |
0 45 oC |
± 0.1 oC |
|
|
pH |
0 14 |
± 0.1 |
|
|
Turbidity |
0 1000 NTU |
± 2 |
Table 4.4 Analytical Methods Applied to Water Quality Samples
|
Parameter |
Standard Method |
Detection Limit |
Accuracy |
|
Suspended Solids (mg/L) |
APHA 2540D |
1.0 mg/L |
±17% |
Decontamination Procedures
4.6.1 Water sampling equipment used during the course of the monitoring process was decontaminated by manual washing and rinsed with distilled water after each sampling event. All of the disposable components/ accessories were discarded after sampling.
Sampling Management and Supervision
4.6.2 All sampling bottles were labelled with the sample ID numbers (including the sampling station), and sampling date. Water samples were dispatched to the testing laboratory for analysis as soon as possible. All the collected samples were stored in a cool box to keep the temperature less than 4 ℃ but without frozen. All water samples were handled under chain of custody protocols and relinquished to the laboratory representatives at locations specified by the laboratory.
Quality Control Measures for Sample Testing
4.6.3 Quality control of laboratory analysis of water samples was performed by a HOKLAS accredited laboratory for every batch of 20 samples:
· A minimum of 1 laboratory method blank was analyzed;
· A minimum of 1 sample duplicate was analyzed; and
· A minimum of 1 sample matrix spike was analyzed.
4.7 Results and Observations 4.7.1 Baseline water quality monitoring at U1, SW, HT, TKW and TKW1 were carried out under HSK/ HT NDA Stage 1 Works in 2022, while baseline monitoring at TSR1a, LUTa, LFS, D1 and D2a were carried out under HSK/HT NDA Second Phase Development in 2024. The monitoring results are presented in the corresponding Baseline Monitoring Reports ([8], [9]). Tables 4.5 and 4.6 summarize the baseline water quality monitoring results already verified under HSK/HT NDA Stage 1 Works. Table 4.7 summarizes the baseline water quality monitoring results already verified under HSK/HT NDA Second Phase Development. Table 4.5 Summary of Baseline Water Quality Monitoring Results of U1, SW, HT, TKW and TKW1 (Wet Season)|
Locations |
Parameters |
|||||
|
Temperature (°C) |
pH |
DO (mg/L) (Middle) |
Turbidity (NTU) |
SS (mg/L) |
||
|
U1 |
Average |
22.6 |
8.1 |
7.3 |
17.5 |
12.8 |
|
Minimum |
19.9 |
7.3 |
4.3 |
4.7 |
3.7 |
|
|
Maximum |
26.8 |
9.1 |
10.5 |
53.2 |
36.0 |
|
|
SW |
Average |
22.7 |
7.9 |
7.2 |
11.5 |
6.2 |
|
Minimum |
20.2 |
7.4 |
3.5 |
1.9 |
<1.0 |
|
|
Maximum |
26.4 |
8.6 |
10.7 |
23.2 |
24.0 |
|
|
HT |
Average |
22.6 |
8.0 |
6.9 |
16.2 |
15.4 |
|
Minimum |
20.2 |
7.3 |
2.2 |
2.8 |
<1.0 |
|
|
Maximum |
26.1 |
8.7 |
10.6 |
45.1 |
69.0 |
|
|
TKW1 |
Average |
22.7 |
8.0 |
7.7 |
14.3 |
9.4 |
|
Minimum |
20.3 |
7.4 |
2.8 |
3.4 |
<1.0 |
|
|
Maximum |
26.4 |
8.7 |
10.8 |
63.2 |
54.0 |
|
|
TKW |
Average |
22.7 |
7.9 |
7.0 |
14.4 |
10.2 |
|
Minimum |
20.2 |
7.4 |
2.4 |
4.0 |
<1.0 |
|
|
Maximum |
26.3 |
8.7 |
10.3 |
57.3 |
52.0 |
|
|
Locations |
Parameters |
|||||
|
Temperature (°C) |
pH |
DO (mg/L) (Middle) |
Turbidity (NTU) |
SS (mg/L) |
||
|
U1 |
Average |
15.0 |
7.7 |
5.8 |
10.1 |
11.4 |
|
Minimum |
12.2 |
6.8 |
3.0 |
4.2 |
1.2 |
|
|
Maximum |
18.0 |
8.7 |
7.6 |
21.0 |
98.0 |
|
|
SW |
Average |
15.5 |
7.5 |
3.6 |
10.4 |
4.9 |
|
Minimum |
3.2 |
7.1 |
1.9 |
2.8 |
1.0 |
|
|
SW |
Maximum |
20.1 |
8.2 |
4.9 |
22.4 |
16.0 |
|
HT |
Average |
16.1 |
7.5 |
2.8 |
9.7 |
3.6 |
|
Minimum |
11.8 |
7.2 |
2.1 |
1.2 |
1.0 |
|
|
Maximum |
18.8 |
8.0 |
5.8 |
31.6 |
8.3 |
|
|
TKW1 |
Average |
16.5 |
7.5 |
2.8 |
9.5 |
3.8 |
|
Minimum |
12.0 |
7.0 |
2.0 |
2.5 |
1.0 |
|
|
Maximum |
20.0 |
8.2 |
4.3 |
17.9 |
12.0 |
|
|
TKW |
Average |
16.4 |
7.4 |
2.9 |
12.0 |
3.9 |
|
Minimum |
11.2 |
7.1 |
2.2 |
3.3 |
1.9 |
|
|
Maximum |
19.9 |
8.1 |
4.2 |
26.8 |
7.6 |
|
|
Locations |
Parameters |
|||||
|
Temperature (°C) |
pH |
DO (mg/L) (Middle) |
Turbidity (NTU) |
SS (mg/L) |
||
|
TSR1a |
Average |
30.6 |
7.6 |
7.7 |
7.3 |
5.3 |
|
Minimum |
25.8 |
6.9 |
4.4 |
1.3 |
1.8 |
|
|
Maximum |
34.4 |
8.2 |
9.7 |
16.2 |
14.0 |
|
|
LUTa |
Average |
30.8 |
7.5 |
5.5 |
6.5 |
5.7 |
|
Minimum |
25.7 |
7.2 |
0.2 |
2.9 |
1.3 |
|
|
Maximum |
34.5 |
8.0 |
7.7 |
10.5 |
20.9 |
|
|
LFS |
Average |
28.4 |
7.3 |
3.9 |
15.2 |
7.9 |
|
Minimum |
25.9 |
7.0 |
0.8 |
8.9 |
2.0 |
|
|
Maximum |
30.3 |
7.6 |
6.1 |
30.8 |
25.0 |
|
|
D1 |
Average |
28.9 |
7.2 |
5.1 |
17.2 |
13.6 |
|
Minimum |
26.0 |
6.8 |
1.0 |
9.4 |
1.3 |
|
|
Maximum |
31.5 |
7.4 |
7.4 |
43.7 |
52.4 |
|
|
D2a |
Average |
30.8 |
7.7 |
2.1 |
7.9 |
15.9 |
|
Minimum |
24.7 |
7.3 |
0.5 |
3.8 |
1.8 |
|
|
Maximum |
35.9 |
8.1 |
4.5 |
11.7 |
138.0 |
|
Table 4.8 Determination of Action and Limit Levels of Water Quality for Impact Monitoring
|
Parameters |
Action |
Limit |
|
DO in mg/L |
Surface and Middle, Bottom DO ≤5%-ile of baseline data |
Surface and Middle DO ≤4 mg/L and 1%-ile of baseline data for surface and middle layers Bottom DO ≤2 mg/L and 1%-ile of baseline data for bottom layer |
|
SS in mg/L |
Depth-averaged SS · ≥ 95%-ile of baseline data or · 120% of upstream control station of the same day (applicable to station at SW and HT only) |
Depth-averaged SS · ≥ 99%-ile of baseline data or · 130% of upstream control station of the same day (applicable to station at SW and HT only) |
|
Turbidity in NTU |
Depth-averaged Turbidity · ≥ 95%-ile of baseline data or · 120% of upstream control station of the same day (applicable to station at SW and HT only) |
Depth-averaged Turbidity · ≥ 99%-ile of baseline data or · 130% of upstream control station of the same day (applicable to station at SW and HT only |
|
pH |
Beyond the range 6.6 8.4 |
Beyond the range of 6.5 8.5 |
Note:
(1) For DO, non-compliance of the water quality limit occurs when monitoring result is lower than the limit.
(2) For SS and turbidity, non-compliance of the water quality limit occurs when monitoring result is higher than the limit.
4.8.2 Based on the baseline water quality monitoring data and the approach specified in Table 4.8, the Action and Limit Levels were derived and are presented in Tables 4.9 to 4.11.Table 4.11 Action and Limit Levels for Impact Water Quality Monitoring at D2a and D1
|
Parameters |
Action Levels * |
Limit Levels * |
|
D2a |
||
|
DO (mg/L) |
5.4 |
4 |
|
Turbidity (NTU) |
11.6 |
11.7 |
|
SS (mg/L) |
14.0 |
15.6 |
|
pH |
Less than 6.6 or greater than 8.4 |
Less than 6.5 or greater than 8.5 |
|
D1 |
||
|
DO (mg/L) |
4.2 |
4 |
|
Turbidity (NTU) |
23.4 |
24.5 |
|
SS (mg/L) |
32.8 |
36.8 |
|
pH |
Less than 6.6 or greater than 8.4 |
Less than 6.5 or greater than 8.5 |
Note:
* Action and Limit Levels are extracted from the Baseline Monitoring Report (December 2024) prepared for Service Contract No. WD/03/2023, Hung Shui Kiu/Ha Tsuen New Development Area Second Phase Development Environmental Team.
(https://hskhtnda-p2.com/upload/HSK%20NDA%20Second%20Phase_BMR_R2(full).pdf?v=1739355176).
5 COMMENTS AND CONCLUSION 5.1 Revision for Inclusion in the EM&A Manual 5.1.1 The baseline monitoring was conducted according to the Updated EM&A Manual for air quality, noise and water quality. 5.1.2 The monitoring methodology, parameters monitored, and monitoring locations are all generally in line with the Updated EM&A Manual. 5.2 Air Quality 5.2.1 According to the layout of HSK/HT NDA Stage 1 Works, 14 air quality monitoring stations were identified for the EM&A programme of non-Schedule 2 DP. 5.2.2 Baseline air quality monitoring at AM18, AM19 and AM20 was conducted from 6 August 2025 to 19 August 2025. The baseline air quality monitoring of AM7, AM8a, AM9, AM11, AM12, AM13, AM15 and AM21 had been carried out and the results were verified by the IEC of HSK/HT NDA Second Phase Development earlier. The baseline air quality monitoring of AM23, AM24 and AM25a had been carried out and the results were verified by the IEC of HSK/HT NDA Stage 1 Works earlier. 5.2.3 Action and Limit Levels for non-Schedule 2 DP under HSK/HT NDA Stage 1 Works were derived according to the Updated EM&A Manual. 5.3 Construction Noise 5.3.1 According to the layout of HSK/HT NDA Stage 1 Works, 5 noise monitoring stations were identified for the EM&A programme of non-Schedule 2 DP. 5.3.2 Baseline noise monitoring at CM6 had been carried out and the results were verified by the IEC of the project of Road Widening Works at Tin Wah Road earlier. 5.3.3 Baseline noise monitoring at CM20, CM22, CM26 and CM30 had been carried out and the results were verified by the IEC of HSK/HT NDA Second Phase Development earlier. 5.3.4 Action and Limit Levels for non-Schedule 2 DP under HSK/HT NDA Stage 1 Works were derived according to the Updated EM&A Manual. 5.4 Water Quality 5.4.1 According to the layout of HSK/HT NDA Stage 1 Works, 10 water quality monitoring stations were identified for the EM&A programme of non-Schedule 2 DP. 5.4.2 Baseline water quality monitoring at U1, SW, HT, TKW and TKW1 had been carried out and the results were verified by the IEC of HSK/HT NDA Stage 1 Works earlier. Baseline water quality monitoring at TSR1a, LUTa, LFS, D1 and D2a had been carried out and the results were verified by the IEC of HSK/HT NDA Second Phase Development earlier. 5.4.3 Action and Limit Levels for non-Schedule 2 DP under HSK/HT NDA Stage 1 Works were derived according to the Updated EM&A Manual. 5.5 Comment/ Recommendation 5.5.1 No further comment or recommendation was provided in this baseline monitoring report.
([1]) Service Contract No. WD/02/2021, Environmental Team for Hung Shui Kiu/Ha Tsuen New Development Area Stage 1 Works Site Formation and Engineering Infrastructure, Baseline Monitoring Report (Environmental Permit No. EP-528/2017), August 2023.
(https://hskhtnda-s1.com/upload/HSK%20Baseline%20Monitoring%20Report_R5_signed.pdf?v=1673843881)
([2]) Service Contract No. WD/02/2021, Environmental Team for Hung Shui Kiu/Ha Tsuen New Development Area Stage 1 Works Site Formation and Engineering Infrastructure, Updated EM&A Manual, April 2022.
([3]) Service Contract No. WD/02/2021, Environmental Team for Hung Shui Kiu/Ha Tsuen New Development Area Stage 1 Works Site Formation and Engineering Infrastructure, Updated EM&A Manual, April 2022.
([4]) Service Contract No. WD/02/2021, Environmental Team for Hung Shui Kiu/Ha Tsuen New Development Area Stage 1 Works Site Formation and Engineering Infrastructure, Updated EM&A Manual, April 2022.
([5]) Quotation No. PU 01/2024: Environmental Team For Road Widening Works At Tin Wah Road, Baseline Monitoring Report, June 2025. (https://www.tinwahroadwidening.lamenviro.com/web/report/EPS/BMR/Baseline%20Monitoring%20Report_final(2025.06).pdf)
([6]) Service Contract No. WD/03/2023, Hung Shui Kiu/Ha Tsuen New Development Area Second Phase Development Environmental Team, Baseline Monitoring Report, December 2024. (https://hskhtnda-p2.com/upload/HSK%20NDA%20Second%20Phase_BMR_R2(full).pdf?v=1739355176)
([7]) Service Contract No. WD/02/2021, Environmental Team for Hung Shui Kiu/Ha Tsuen New Development Area Stage 1 Works Site Formation and Engineering Infrastructure, Updated EM&A Manual, April 2022.